

Climate View
A specialized tool for analyzing, monitoring, and mapping climatic parameters and water quality, independently of other software.
Climate View software, by processing climatic and hydrological data, automatically and accurately produces maps and analytical reports pertaining to precipitation, temperature, evaporation, water quality, and overall climatic conditions.
Key Attributes
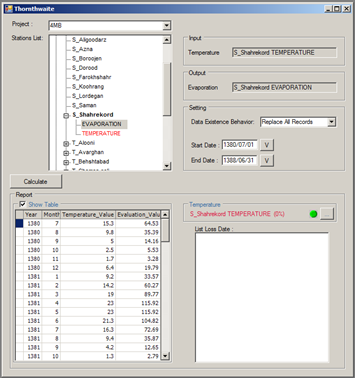
Climatic and Hydrological Analysis: The capability to process and analyze data on precipitation, temperature, evaporation, groundwater level, and water quality using diverse scientific methods.
Map Generation and Interpolation: Creation of climatic maps using methods such as Kriging, IDW, and elevation gradient.
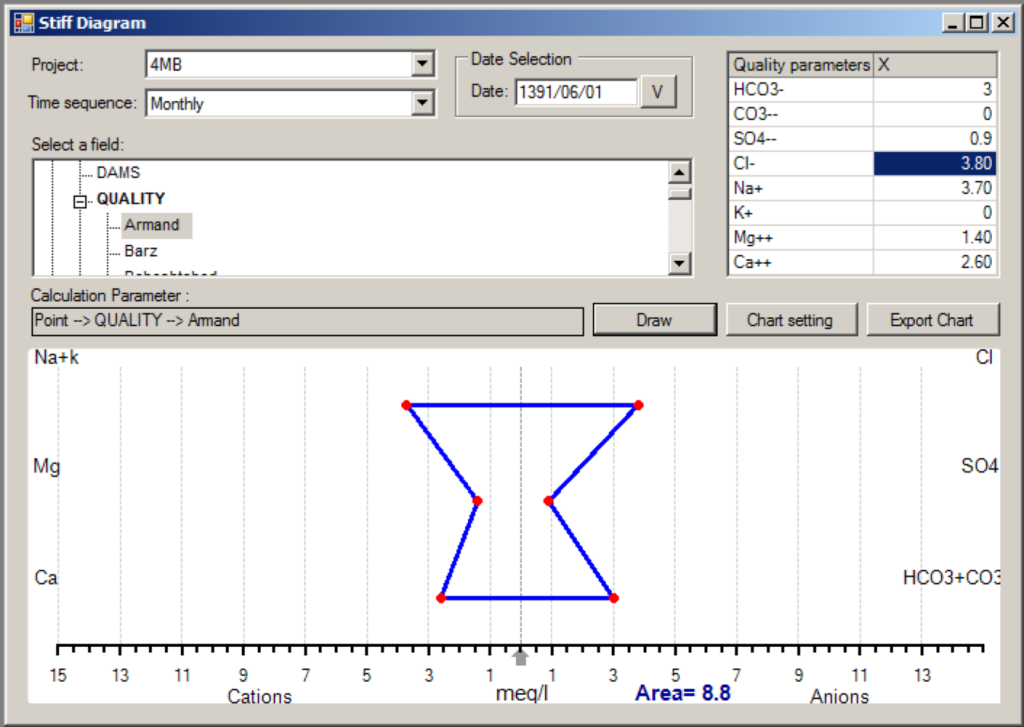
Water Quality Analysis: Assessment of surface and groundwater quality using models such as Schuler, Wilcox, Stiff, and Collins, along with the generation of specialized charts.
Drought Analysis and Climate Classification: Based on indices such as De Martonne, Ambrogeti, SPI, RAI, and other recognized climatic indices.
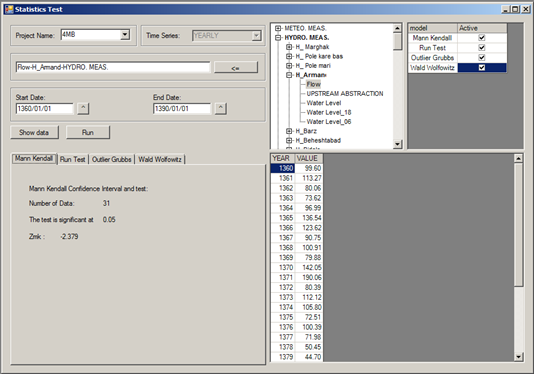
Statistical Tests and Data Examination: Performing outlier, trend, independence, and homogeneity tests.
Advanced Reporting: Preparation of tables, charts, and management reports for use in research and implementation projects.
Network Deployment Capability: Usable by multiple users simultaneously, with access control and enhanced security features.
Technical Architecture:
This software is developed in C# within the .NET Framework environment, designed with a multi-layer architecture, and utilizes local databases.
Operational Logic:
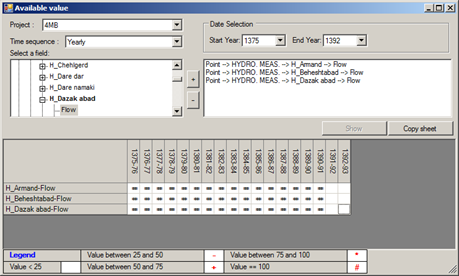
The operational framework of the Climate View software is based on processing climatic and hydrological data from various stations and converting them into analytical and map-based information for decision-making. The software receives data such as precipitation, temperature, evaporation, water quality, and groundwater level. It first performs data validation and cleansing through statistical tests, then generates climatic maps using interpolation methods such as Kriging and IDW. Subsequently, through the application of various scientific models, indices such as water quality, climate classification, drought severity, and water balance are calculated, with the results presented in the form of charts, tables, and analytical maps.
Why Climate View?
Localized design for each country:
Algorithms and indices are adapted to the country’s climatic conditions, enhancing the accuracy of results across diverse regions.
Independence from external software (e.g., ArcGIS):
Climate View provides full capabilities for generating maps and analytical reports without reliance on external tools.
Integrated analysis of climate and water resources data:
All stages—from data acquisition, processing, and statistical analysis to output generation—are performed within a single environment.
Support for diverse analyses:
Including precipitation, temperature, evapotranspiration, water quality, groundwater level decline, rainfall intensity–duration, and drought indices (SPI, CZI, etc.).
Network-based, multi-user environment:
Ideal for organizations and expert teams requiring shared and simultaneous access to data.
Comprehensive reporting and visualization:
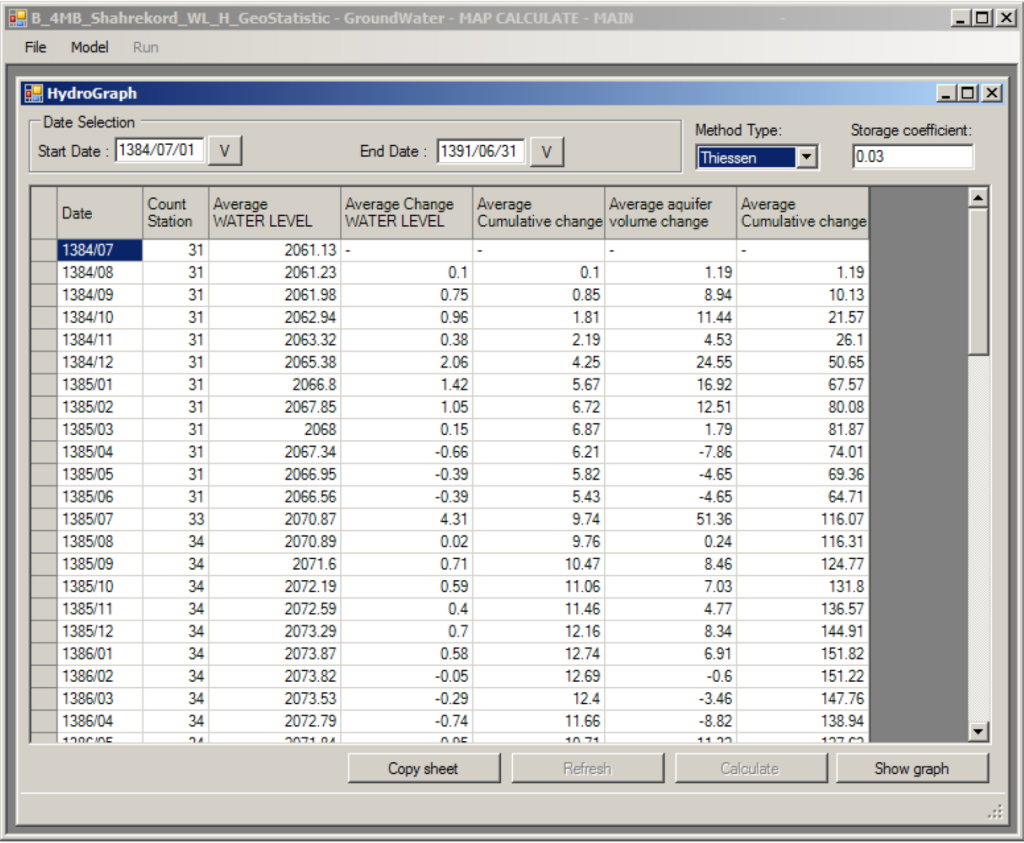
Generates hydrographs, water quality charts, balance diagrams, and statistical tables, with outputs readily usable in Excel and Word.
Security and access control:
Multiple users can be defined and managed with different access levels, ensuring secure data handling.
Software Workflow Cycle
- Data Acquisition: Collecting climatic data from meteorological stations or databases.
- Data Validation: Checking accuracy, identifying anomalies, and addressing statistical gaps.
- Data Processing: Applying spatial interpolation and analytical methods.
- Map Generation: Producing maps of climatic parameters such as precipitation, temperature, evaporation, water quality, and more.
- Index Calculation: Computing statistical indices, water balance, drought indicators, and water quality assessments.
- Visualization: Generating analytical and climatic charts, including hydrographs.
- Reporting: Preparing output reports compatible with Word, Excel, and PDF formats.
- User & Access Management: Managing users and permissions within the software’s network environment.
Organizations That Could Benefit from Climate View
- Regional Water Authorities
- Water Resources Management Organizations
- Consulting Firms in Water and Environmental Fields
- Academic Researchers
Conclusion
Climate View software provides a comprehensive solution for the monitoring, analysis, and reporting of climatic and hydrological data. It is a precise, independent, and adaptable tool for generating climatic maps, evaluating drought and water quality indices, and supporting informed decision-making in meteorology and water resource management. The software is designed to meet the needs of specialized organizations, research institutions, and executive agencies worldwide.