Station View
An intelligent tool for acquiring, processing, monitoring, and extracting information.
Station View software is a powerful solution for comprehensive environmental data management. With a modular architecture, it enables the acquisition, processing, and visualization of data from diverse monitoring stations without the need for specialized hardware. Featuring a user-friendly design, support for multiple communication protocols, and a multi-layered architecture, it is a professional choice for organizations engaged in water resources, environmental management, meteorology, agriculture, and disaster management.
Key Attributes
Real-Time Multi-Purpose Monitoring: Station View software enables continuous monitoring by receiving real-time meteorological and environmental data. It supports ongoing observation under both normal and critical conditions, serving key domains such as urban planning, agriculture, water resources, and environmental management.
Quick Installation, Hardware-Independent, and User-Friendly Design:
Station View can be easily installed and deployed without the need for specialized equipment. Its intuitive and streamlined interface ensures accessibility for users with varying levels of technical expertise.
Flexible Data Acquisition:
The software supports both automated and manual data collection through network connections, modems, SMS, or operator applications—without the need for specialized equipment.
Integrated Connectivity with Management Systems:
By supporting APIs and standard communication protocols, the software can establish direct connections with alert systems, management dashboards, and both organizational and cloud-based databases.
High Accuracy and Data Security:
The software automatically validates data quality, eliminates erroneous values, and ensures secure storage within a centralized database, with user-specific access levels for controlled data management.
Scalable for Network Monitoring:
The software is designed to expand seamlessly, enabling simultaneous monitoring of multiple stations (point, line, or area) across different regions, with comprehensive numerical, graphical, and analytical reporting.
Technical Architecture:
This software is developed in C# within the .NET Framework and is built on a multi-layered architecture, leveraging both temporal and spatial databases. It supports real-time data acquisition and processing through protocols such as GPRS, SMS, PSTN, and radio modem.
Key technical features include support for Windows services, automatic execution upon server restart, and parallel scenarios with dynamic switching capability.
User interfaces are designed for Windows, Web, and Mobile platforms, ensuring full integration with geospatial databases and guaranteeing real-time data visualization.
Operational Logic:
The operational logic of Station View is based on the processing and analysis of environmental data collected from various stations, designed to support monitoring and reporting of station conditions and to enhance management processes. The software acquires data such as water level, temperature, wind speed, air pressure, and other environmental parameters from multiple stations. These data are first validated for accuracy and reliability, and if necessary, corrected and cleansed. The results of the analyses are then presented in the form of charts, tables, and analytical reports, enabling users to make more informed decisions regarding the management of natural resources, climate, and other environmental indicators.
Why Station View?
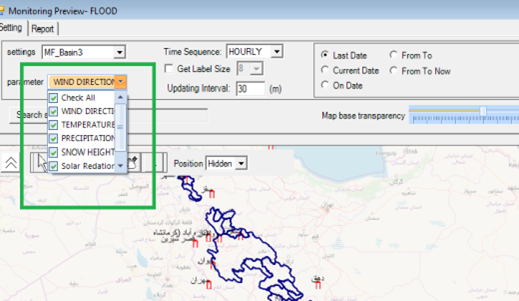
Flexible Station Definition
The software allows defining points, lines, and areas as stations. Each station can store time-series data (minute, hourly, daily, etc.) across various categories such as rainfall, evaporation, or water level.
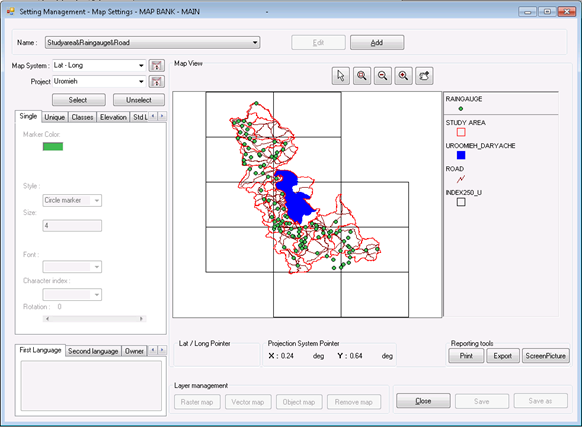
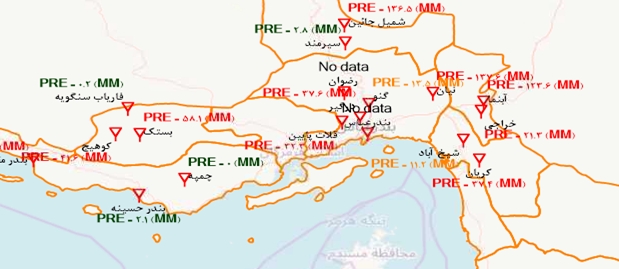
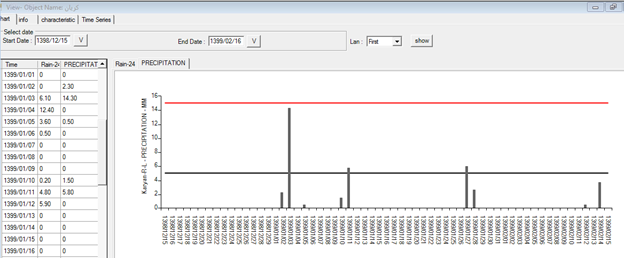
Data Extraction – Numerical and Visual
Data can be extracted in numeric form (single station or aggregated) and in visual form, displayed schematically on a global map with full geospatial accuracy. Outputs can also be generated in slideshow format for presentations and reports.
Automated Data Validation
Upon receiving new data, the software automatically identifies and separates valid and invalid records to ensure data integrity.
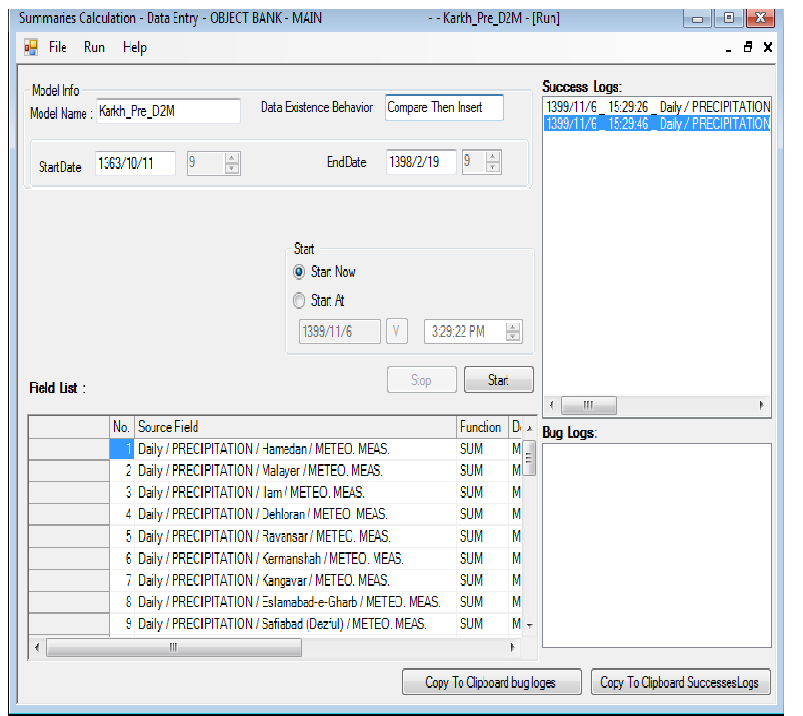
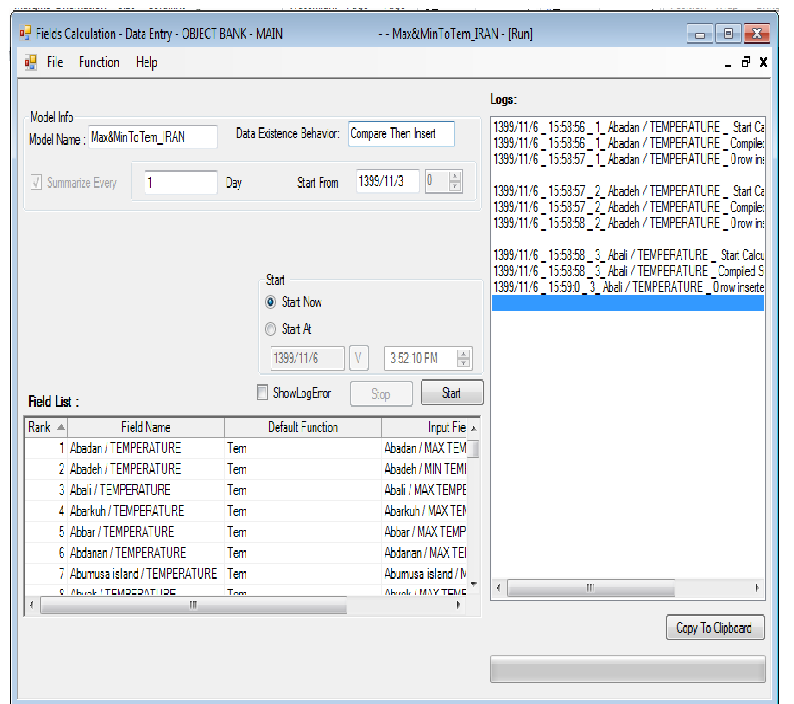
Automated Data Processing
The system can automatically aggregate smaller time steps into larger intervals (e.g., minute-to-hour, hour-to-day) and convert related data types using predefined relationships (e.g., water level to discharge, water volume to flow rate).
Automated SMS Alerts
Based on user-defined needs, the software can send automated SMS notifications. Examples include hourly cumulative rainfall reports, daily lists of active reporting stations, and critical alerts when river water levels exceed warning thresholds
Role-Based User Access
For organizational security, the software supports defining multiple user levels with customizable access rights, ensuring controlled and secure use across teams.
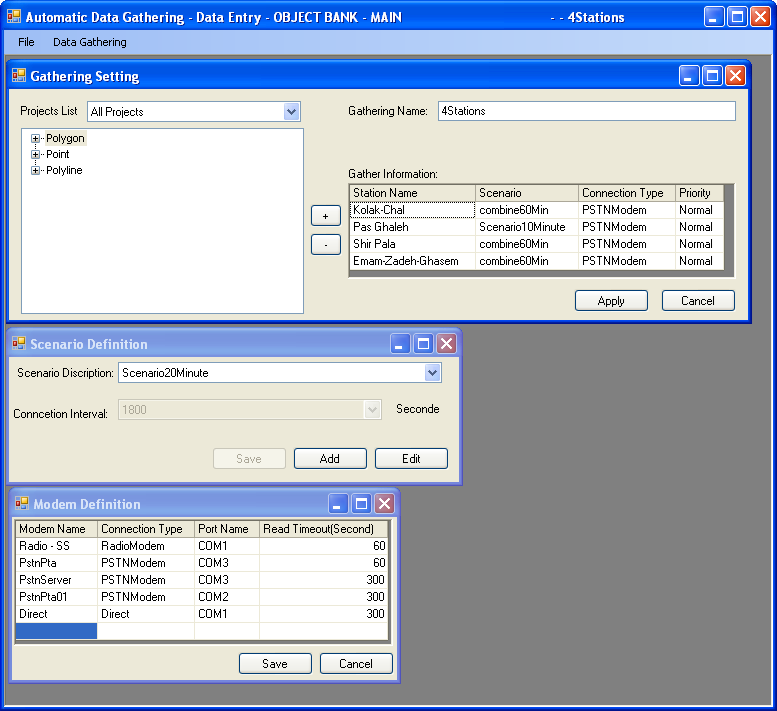
Software Workflow Cycle
- Station Definition: Stations are first defined as points, lines, or areas depending on the monitoring requirements.
- Subset Definition: For each station, subsets such as rainfall, evaporation, discharge, or water quality are configured.
- Data Acquisition Settings: Data reception is tailored for each source, with specific configurations for transmission methods.
- Data Validation: Incoming data is checked for accuracy; invalid records are flagged and stored separately as error data.
- Data Processing: Validated data is processed through temporal aggregation (e.g., minute-based to hourly) and conversion of values using domain-specific formulas, such as volume to discharge.
- Data Storage: All validated and processed data is securely stored in a spatio-temporal database for structured retrieval.
- Data Extraction and Visualization: Users can access outputs in multiple forms: numerical tables for one or more stations, schematic representations of rivers or dams, global map overlays with statistical or time-series analysis, or slide-based reports with cumulative charts and key indicators.
- User Management: The system supports multi-level access control, allowing administrators to assign detailed permissions for viewing, editing, or uploading data according to organizational security requirements.
Organizations That Trusted Station View
The software has been trusted and adopted by several regional and national organizations, including the Regional Water Companies of Hormozgan, Ilam, Ardabil, West Azerbaijan, Khuzestan Water and Power Authority, Chaharmahal and Bakhtiari, Mazandaran, and others.
Conclusion
Station View, with its comprehensive coverage of the entire data cycle—from acquisition to analysis—is a reliable, precise, and flexible tool for monitoring and managing environmental data within specialized and executive organizations.